|
|
OpenMSI is a mass spectrometry imaging (MSI) analysis tool developed at Berkeley Lab. This technology makes use of the high performance computing resources at the National Energy Research Scientific Computing Center (NERSC). With OpenMSI, users can easily upload, analyze and share results of MSI experiments. The tool enables simultaneous visualization of the spatial localization of three user specified ions. The mass spectra for two points may be compared by clicking the desired locations on the image. Demo data is available publicly while private data upload/analysis/visualization is available for registered users. Oliver Rübel, Annette Greiner, Shreyas Cholia, Katherine Louie, E. Wes Bethel, Trent R. Northen, and Benjamin P. Bowen. OpenMSI: A High-Performance Web-Based Platform for Mass Spectrometry Imaging. Analytical Chemistry 2013 85 (21), 10354-10361, DOI: 10.1021/ac402540a. [BibTeX][Online at ACS] |
|
|
The Metabolite, Annotation and Gene Integration (MAGI) toolkit was developed to enable a means for linking metabolomics with genomics data. This web-based service requires an email address to send the results and two input files: (1) contains a list of compounds identified by InChI keys, mass to charge ratio or neutral mass and (2) a FASTA file containing DNA, RNA or amino acid sequences. With this information, an analysis ‘job’ is submitted to the MAGI service at the National Energy Research Scientific Computing Center (NERSC). Results are then returned to the user which include a list of scored reaction and gene matches associated with metabolites and a list of scored metabolite matches associated with genes. The results may be used to build testable hypotheses of biochemical transformations. Registration is not required and a tutorial is available on the website. Onur Erbilgin, Oliver Rübel, Katherine B Louie, Matthew Trinh, Markus DeRaad, Tony Wildish, Daniel Udwary, Cindi Hoover, Sam Deutsch, Trent R Northen, Benjamin P Bowen. MAGI: A Bayesian-like method for metabolite, annotation, and gene integration. (Submitted) BioRxiv Volume(issue):pages, DOI: 10.1101/204362 |
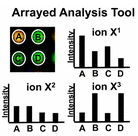 |
The OpenMSI Arrayed Analysis Tool (OMAAT) enables high-throughput analysis of mass spectrometry imaging (MSI) data in combination with the OpenMSI web tool. Briefly, data from samples arrayed on MSI imaging surfaces are uploaded through OpenMSI and accessed with the OMAAT python package; using a jupyter notebook, the spots are automatically located and evaluated for abundance of selected ions. Data can be visualized within the notebook and exported in tabular format for further statistical analysis and graphical representation. OMAAT is freely available to use with demo data from OpenMSI, but requires OpenMSI registration to upload new data. Markus de Raad, Tristan de Rond, Oliver Rübe, Jay D. Keasling, Trent R. Northen, and Benjamin P. Bowen. OpenMSI Arrayed Analysis Toolkit: Analyzing Spatially Defined Samples Using Mass Spectrometry Imaging. Anal. Chem., 2017, 89 (11), pp 5818–5823 DOI: 10.1021/acs.analchem.6b05004 |

|
The Metabolite Atlas workflow is used for efficient and accurate analysis of mass spectrometry datasets using python based scripting containers and SciDB (a database hosted at National Energy Research Scientific Computing Center (NERSC). Data is uploaded to NERSC and compared against a screening atlas of m/z and retention time values. The screening atlas contents may be generated from analysis of pure reference standards or from an untargeted analysis producing a list of ‘features’. This atlas is then filtered to a list of high quality annotations based on m/z, rt, MS/MS fragmentation spectra and isotope abundance ratio data. MS/MS spectra are compared with at least one of the following three sources (1) pure reference standards analyzed in house using the same instrument methods as the samples, in silico fragmentation predictions, and other spectral databases (ex. MONA, NIST, etc.). Customization of python scripts allows for visualization of extracted ion chromatograms, MS/MS mirror plots, and other graphical representations of the data. Additionally, metadata stored with the datafiles can be used to evaluate treatment groups for statistical comparison of metabolite abundances. MetaboliteAtlas workflow requires a NERSC account. Yushu Yao, Terence Sun, Tony Wang, Oliver Ruebel, Trent Northen and Benjamin P Bowen. Analysis of metabolomics datasets with high-performance computing and metabolite atlases. Metabolites, 2015, 5(3), pp 431-442 DOI: 10.3390/metabo5030431 |
| Web of Microbes (WoM) is a repository of experimental assertions on how organisms transform their environments through the increase and decrease of metabolites. These assertions are based on direct experimental evidence obtained through exometabolomic analyses. Currently, the database containes results from carefully curated mass spectrometry datasets from the Northen Metabolomics Lab located at the Joint Genome Institute, a DOE National User Facility of Lawrence Berkeley National Laboratory. WoM captures assertions: metabolite compositions of environments and the changes to metabolite abundances metabolites by organisms in the environment. | |
| The EcoFAB initiative was announced in 2015 as a cross-functional team of biologists, geologists, and ecologists from Berkeley Lab to provide critical new insights into ecosystem processes through the creation of controlled model ecosystems in which microorganisms and host responses can be monitored in response to additional or changing variables. This program is in close collaboration between Environmental Genomics & Systems Biology (EGSB), Joint Genome Institute (JGI) and Earth and Environmental Sciences Area (EESA) Divisions. | |
| Berkeley Lab MS/MS spectral library is open-access and contains 24,563 MS spectra of endogenous metabolites. GNPS is a community based open-access knowledge base created through collaborated efforts and sharing of mass spectrometry data. Our lab uses this tool for spectral mapping of MS-MS data. Data compiled and analyzed by the Northen Lab and DOE JGI. |